Lab tests
Lab tests are extremely useful as they are an objective assessment of your physiological ability.
Pro’s:
- Held under very controlled conditions so should be directly comparable to each other.
- A likely gold standard of your tested physiology, strength or functionality (depending on the test you are having done).
Con’s:
- Getting access to a lab or facility to have them done might be an issue based on where you live.
- Possibly expensive.
- Any test you do needs to have what I would call ‘actionable intelligence’. This means, data is good but you need to be able to do something about it in your training plan. You might need the help of a good sports scientist or coach to help you with this.

The bottom line: Any type of test you do needs to be as specific to the sport or its needs as much as possible. For example, doing an exhaustive ramp test, lactate threshold test or Vo2 max test is great but the most specific method would be on a SUP ergometer, not, for example, running on a treadmill. The more specific the test, the more applicable the results.
So after all of these, what should you do? Well, I’ve been playing around with some other techniques so I thought I would share one method that I’ve been using.
I’m particularly keen on data. Lots of it!
I snatch data like a vacuum cleaner trawling over a pair of socks. I’ve been using what I call an input/output ratio score (or I/O). I’ve discovered that this is similar to other methods used in running including one by renowned coach Joe Friel and another in a scientific paper by Ville Vesterinen in 2014. The I/O score is generated by regularly paddling over the same course, therefore drawing on the best aspects of time trials but providing some elements of lab tests that allows me to make decisions on my training at this time of year and allows more direct comparison between outdoor trials. The I/O score is generated by recording your average heart rate and average speed over the time period of your choosing. Once I’m back home, I then divide my resulting average heart rate of this period by the average speed I paddled it at. This gives me a basic ratio.
So, in the case of SUP, let’s say you produced a 1 hour average heart rate of 130 beats per minute which was then divided by a speed of 8.3km/h. This produces an I/O value of 15.7. By doing this same effort over the same course every so often, I build up a lot of data I can then compare directly to each other in something like an Excel spreadsheet. If the score reduces, you’re either producing more power for the same speed or becoming more economical or efficient. However, the actual figure you calculate is arbitrary – do the test somewhere else – change the course, your paddling intensity or equipment and the I/O value won’t be comparable. For example, the hydrodynamic drag your board creates isn’t the same at all speeds. The higher the paddling speed, the power required to achieve it goes up exponentially (the graph to show this would look like a ski jump ramp). The power you need to produce to go from 6-7 Km/h is a lot lower a jump to that of 9-10 Km/h. Any paddle that isn’t performed using the same conditions, reject it – no matter how good or bad it is. Likewise, sometimes Mother Nature produces a one off score that might seem out of kilter with previous days. Anything that doesn’t consistently happen in several paddles, reject that too.
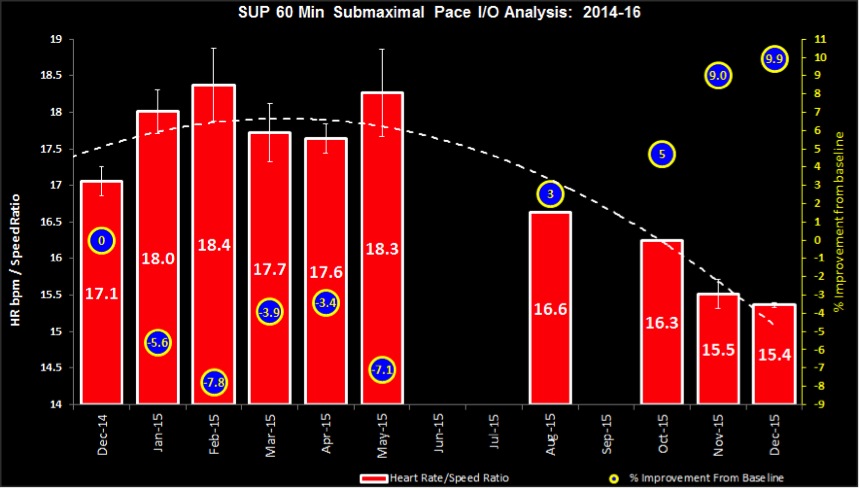
To give you an example I’ve constructed a graph showing mine over the period of one year over the duration of one hour. I’ve picked my best half dozen I/O’s for each month and averaged them out. Why? Well, using an out and back course reduces the impact of currents and winds and then averaging these over multiple paddles minimises this further (personally calculate a margin of error to make sure the data quality is good). Here’s how mine looked:

The red bars are my average I/O ratio, the white line at the top of each bar is the margin of error and the blue circles are my performance improvement from the original starting point of December 2014. Notice how things went south from January until May? Why? Well, checking my training logs showed I adjusted my plan around that time and I went through a huge increase in the volume of cycling I was doing meaning I was pretty tired by the time I got on a board. From October I specialised my training in SUP and that’s why you’re seeing a dramatic decrease in I/O from that point.
The thing to bear in mind is that eventually your I/O won’t change much. This might be due to the fact you have reached a well-trained state over the duration you’re looking at and therefore less likely to see huge improvements. Alternatively, your I/O might plateau. In this case, that’s when you need to really build in some progression to your training. Put simply – go harder, go longer or reduce your recovery time down (but not all 3 at once!). Once you start to do that, this should prompt your body to adapt and you might squeeze a bit more fitness out and drop this score further.

Words : Dr Bryce Dyer.
2015 was Bryce’s first SUP race season, racing on the water whilst still maintaining his track form on the bike. For 2016 he’s going to be concentrating on SUP which will be interesting for us to watch. But probably a bad thing if you finished ahead of him last year! Better get training!