SUP can be the most simple sport in the world… just the board, paddle and you. Or if you want it to be, SUP can be pretty technical too! One paddler who loves that technical side to the sport and is always looking to find the answers to those tricky questions is regular SUPboarder contributor and racer Dr Bryce Dyer. Bryce feels just as at home infront of a spread sheet and complex graph, as he does on the water! In this feature Bryce gets techy and explains how its possible to test and find the fastest board for you. So grab a coffee, get your brain cells in gear, and get reading!…
Board Testing 101 – How to find out what board is the fastest for you
When it comes to knowing which board to use, many of us are swayed by what the top pros have or what the magazines tell us. If you’re looking for your next flat-water race board, the answer will most likely be your favoured compromise between speed, stability and handling. However, if straight line speed is your main goal, you might well be asking that with the dazzling array of SUP boards now available, is there really that much difference between one board and another and if so, is it really worth worrying about?
As far as SUP goes, this isn’t a new debate and if you poke around on the internet, you’ll see that a few people have tried field testing their boards in the past to see if one is faster than another. The problem is that these tests don’t often have enough runs to produce reliable results, do not use speeds that are representative of your own racing or just aren’t objective. This makes any results typically inaccurate, unreliable or unrepresentative.
If you wish to test some boards yourself, my key underpinning factors that any board test experiment needs to have is:
- to make sure that the conditions of the test are as known and constrained as possible (so are therefore consistent and repeatable).
- to ensure that the test conditions are representative of your paddling (such as using your own board speeds and the water conditions used).
- to conduct enough runs to produce an answer that is statistically reliable (and preferably has a margin of error).
- plenty of time and the need for patience. Field testing can be fickle and bad runs will have to be binned. A test is only as good as the process behind it.
The boards on test
For this article, I tested two boards and I’ll show you some tests that you too can do outdoors. The test boards were both 14ft long hard boards from a well-known manufacturer.
Board A : An all-round carbon race board 26.5” wide.
Board B : A flat-water specific carbon race board 26” wide.
These models are competitive boards from a well-known brand and typical of those raced in events. The boards were sourced by myself and were not influenced by sponsors or any third parties.
Test conditions
The tests themselves were conducted very early in the morning and at a venue that was a local reservoir that was fully surrounded by trees. This ensured that the test venue was free from wind and water flow (which would influence and increase the margin of error of the results). It could be argued though that such flat and undisturbed water is not representative of a typical board race. However, it is important to see how robust the field testing is under the simplest possible conditions before then incorporating more chaotic elements (such as chop or wind) in the future. I also mark where my feet will be standing on each board with my chosen stance to ensure the board trim is the same when using the same board, use the same paddle and wear tight fitting clothing that does not flap around to increase affect the aerodynamic drag. By not consistently controlling either of these could affect your results.
What is being measured?
In theory, provided you do enough test runs, you could just do as many others have and just use average speed as a means to determine whether one board is faster than another. However, I personally do not recommend this and always use at least two different metrics to gauge a piece of equipment’s performance. In this case, I recommend the use of both speed (in kph) and stroke rate (strokes per minute). Heart rate could also be used but the problem with it is that it takes too long to respond to your work effort – especially with shorter tests or with maximum exercise intensities.
Stroke rate might be a new thing for you to consider but published research in other paddle sports has shown that there is a strong correlation between both stroke rate and how hard you are physically working. To obtain stroke rate data, some computers or GPS units provide this information for you or you could count them in your head yourself. I should add at this point that I’m supported this year by Nielsen Kellerman so for these tests I was using their excellent SUP Speedcoach 2 device which provides stroke rate as one of its outputs.
When using stroke rate, I typically normalise the performances between boards by using an input/output ratio. Readers from a previous article of mine might recall that the use of an input/output ratio (I/O ratio) has been used successfully in published sports science research before as a means of tracking changes in fitness in the absence of power output data. For these tests though, I create a new ratio by taking the stroke rate of a test run and then dividing this by the average speed of the run in kph. This then produces a figure that allows you to compare one run to another more directly when the speed or the stroke rate of multiple runs might vary very slightly. In theory, provided the speed you were paddling at were similar between two test runs, the board that has a lower I/O ratio is the one to opt for as its taking you less strokes to drive it to obtain the same speed.
Purely out of scientific curiosity (and my general love of all things R&D), I undertook 3 different types of board tests and I’ll show you the results I got. These tests were:
Test 1: A race pace time trial performed over 350 metres
This test had two different intentions. The first was to ascertain how stable the weather conditions and my paddling actually were to see how reliable I am personally as a tester. The second is to see what board produces the lowest I/O ratio. Test 1 is important to me personally because as a scientist, I like to ensure my process is fundamentally sound before moving on with other tests. To achieve this, I performed 10 separate runs at the targeted pace of 9kph (paddling in one direction and then using the return leg back for recovery before going again) over a measured distance of 350 metres over the same course. This might seem short but this kind of distance has been successfully used before to detect the hydrodynamic differences in sprint kayak designs. If the test run is too long in distance or duration, you’ll tire and not get enough runs in. I used a targeted speed of 9kph as this is typically what many of my own flat-water distance races would typically average at.
I would perform 2-3 test runs with one board, then the same with the other and then repeat this cycle again (total runs=10 per board). By randomising (or alternating) the test boards then minimises any changes in weather or conditions that could be hidden if you did 10 straight with one board and then 10 with the other. Here were my own results:
| Board A (All water) | Board B (Flat-water) | |
| Average Speed (9kph target) | 9.26 kph±0.0 | 9.22 kph±0.1 |
| Average Strokes per minute | 52±0.3 | 49±0.5 |
| I/O Ratio | 5.65±0.0 | 5.35±0.0 |
| Stroke Length | 2.98m±0.02 | 3.13m±0.01 |
So firstly, notice that my margin of errors (note: the +/- values) were very small. This tells me that my paddling performance between all the test runs were very similar so ultimately that means my own field testing process is both stable and very repeatable. (Note: I have other stats to back this up but I have not included them for succinctness).
Results: Whilst you might see that the speed is higher for A than B does this mean it was the better board ? No. Notice how the I/O ratio is lower for Board B than it is for Board A. What does that mean ? It means that Board B requires much less effort to hold 9kph than Board A does. The bottom line is that’s around 2-3 strokes per minute you are saving (or 162 strokes in an hour). That’s energy in a race you’ve just saved. Alternatively, look at the difference I obtained in stroke length (calculated as the average from each test run length divided by the number of strokes it took). In this case my stroke length was 0.15m longer with Board B than it was for Board A. I can use another ratio to normalise their speed but in simple terms it means I could gain 540 metres per hour in raw distance. If you’re moving at around 9kph for an hour, that’s a whopping 3 minutes and 36 seconds of gain. That’s a worthwhile gap when you’re not in a draft train and bear in mind that a gap that large would easily shuffle the places on a podium at events around the globe.
Test 2: Board performance when at varying speeds
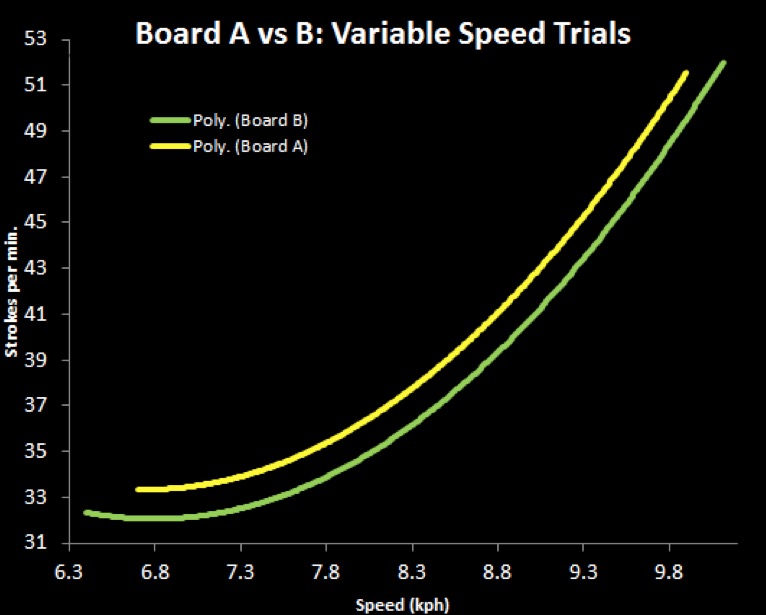
Test 2 is an alternative method to test 1 and was (bizarrely) based on some previous research I’d had published on the aerodynamic performance of prosthetic legs used by Paralympians. What you do in essence is test a board at a range of speeds. Rather than worrying about margins of error or performance of the board at one speed, you measure how a board performs across a variety of speeds. You test a board using fixed distances at a variety of speeds and you then draw a graph (using spread sheet software like Microsoft Excel) of speed versus stroke rate to achieve them. You then run a line of best fit through all the data points which then shows you the average performance of a board. Bear in mind that you should delete any bad test runs that stand out in the results.
In my case, I chose speeds from 6-11kph in 1kph increments and did 6 runs of each (losing one of those to a bad run). Again I alternated between boards and also randomised the order of the test speeds. I used the 350m test course again from test 1.
If you’ve done the testing right, you should hopefully produce a ski jump shaped trace like what I obtained. The reason the graph trace is shaped like this is that all boards have a maximum speed based upon their length and width and when you approach (or try to exceed) this, the power needed to increase the speed any further increases exponentially. For example, it is a lot easier to increase a board from 6km/h to 7km/h then it is from 9km/h to 10km/h (despite both cases only being a 1km/h increase). Ultimately, whichever board has the highest speed for the lowest number of strokes is basically the quicker board as it is likely taking less effort to propel it. The beauty of this method is that all you need to do is to produce as many runs as your time allows and then run a line of best fit through them. The more runs the better. Here’s what I got in my tests:
Results: The results of both boards formed a near perfect curve. As per test 1, see again how Board B takes fewer strokes to achieve the same speed then Board A ? For you, this graphic is all you need to know that you’re on a faster board or not [note: at this point go to the bar, change your sponsor or put on your protective armour and convince your significant other that a new board is clearly now warranted].
However, I did a little more number crunching to see what the gain actually was. A graph like this can allow you to predict how many strokes are needed for a given speed and then predict a performance. In this case, I obtained that Board B would be around 3 minutes and 50 seconds faster than Board A in an hours race on very flat water when at 9kph. That’s huge and not dissimilar to the 3mins 36 I predicted from test 1’s results. In a race (whereby you’re not in a draft train for most of its distance) that is an amazing gain to be aware of.
Test 3: Hydrodynamic drag tests
This final test I tried was based upon some research whereby the traditional method of assessing watercraft hydrodynamically is often achieved by using models placed in tow tanks. The problem with this is that this likely isn’t financially viable for many small companies so some researchers had attempted to seek alternative methods by getting rowing crews to paddle a fixed number of strokes to reach a maximum speed, raising their oars from the water and then timing the amount of time the craft took to reach back to a stationary position (or low speed). This would allow them to see how a craft slows down without being paddled and therefore which type of rowing shell had the least hydrodynamic drag.
This is a quick and easy test that doesn’t require a lot of time or space. However, water conditions must be absolutely calm (and it took me a few attempts to get it right). I did this test method by accelerating the boards to their maximum speed I could achieve using a fixed number of strokes (15 in this case – and it’s important not to switch sides with the paddle). Once I’d hit 15 strokes, I lifted the paddle clear of the water and sat the blade resting on the deck of the board in front of me in the same position for each run and glided until I stopped. This test completely isolates the board’s performance from that of the paddling action and exclusively judges the hydrodynamic drag of the board alone. I did at least 10 runs of each board so I could calculate the statistical reliability of the test and the margin of error for both boards’ performances.
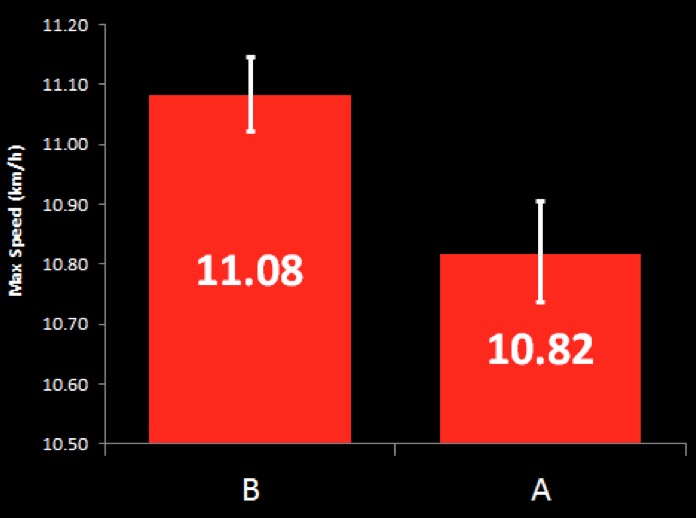
So how did this go ? First, let’s look at the maximum speed I obtained.
Max speed is only part of the story of a board’s performance since a board may perform differently to another at 11kph compared to them moving at 7kph. This is due to how the water might flow differently across its surfaces based on the speed it is moving . However, when this information is used in conjunction with other tests, it helps reinforce the results from tests 1 and 2. Either way, it’s useful to note that Board B was able to hit a higher top speed in the 15 stroke limit.
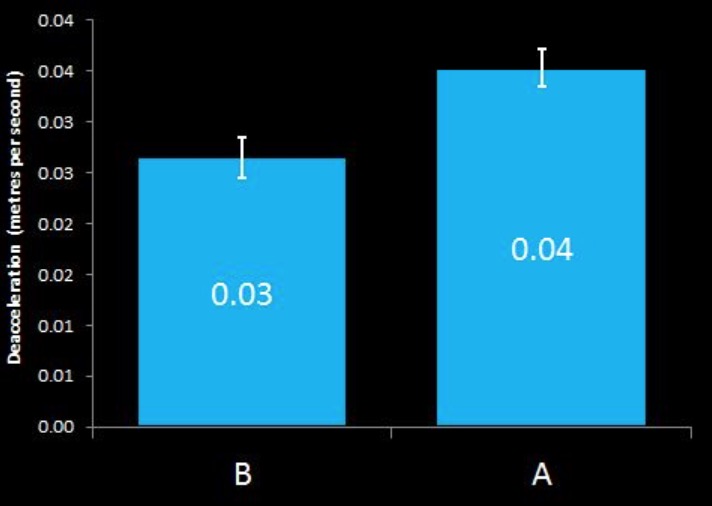
As for the de-acceleration of the boards, here are those results:
In these, there was a 1kph difference in the results. In fact, Board B was 25% lower than Board A meaning less hydrodynamic drag is acting on Board B. In summary, this means Board B’s flat water specific design will have a better glide, it will be easier to accelerate and will achieve a higher top speed in these kinds of waters. That’s useful if you’re looking to make a break from a draft train or deciding how hard (and when) to go in a race.
Conclusion:
For reasons of conciseness, I didn’t include all of my testing analysis here – its vast and that’s going to hopefully be submitted to a scientific journal later this year. However, what has all of this taught us? Firstly, no matter which of the tests you choose, you can get reliable results by using any of them. However, I personally love board R&D but you need both the time and the patience to do it properly.
Secondly, Board B was proven in all tests to be a faster board for me in flat-water than using more of an all-round design in Board A. This is likely obvious to most of you but you might have underestimated by how much any gain would be. They were large here but results would change if your paddle stroke fatigues, you were subjected to rougher water or spent time drafting others. Ultimately, any results you ever see in tests will vary based upon your weight, size, paddling style and test environment. You’ve got to do the testing yourself to be sure of what is best for you but hopefully my article does show you that board choice does matter when racing and there is free speed to be had out there. Shop wisely and look beyond the marketing brochure is always my advice. Or in simpler terms – demo, demo, demo!
Bryce’s supporters in 2016 include Naish UK, FC Watersports, Quickblade paddles, The SUP Hut, Nielsen-Kellerman and Red Venom compression wear.
Words : Dr Bryce Dyer.
So, before you rush out to buy that shiny new board on the front of the latest brochure, or the exact replica of the board that beat you at the last event, take some time to try out some different kit and do your own R&D, to find out what board is best for YOU. Board R&D doesn’t have to be complicated and it can actually be quite fun. You just need to find the time to do it! Happy testing!


