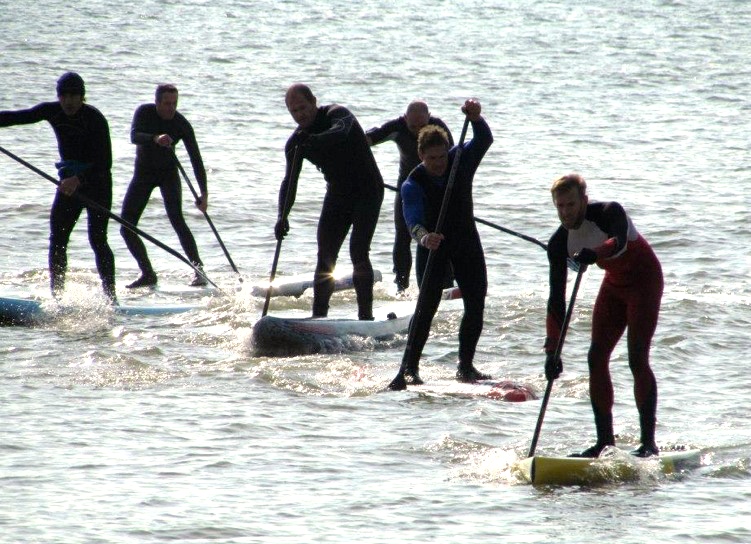
Bryce Dyer is a SUP racer with an eye for a statistic. As a competitor in the BaySUP Frostbite series he’s taken an analytical look at the performances so far from the series. In this feature, we get a thought provoking flavour for some brilliant analytical techniques we will see more and more at the top of the racing fleets as SUP racing develops…
The BaySUP 2014-15 Frostbite SUP Series
Down on the south coast of the UK, BaySUP are currently running their 6 race winter SUP series. The series has grown successfully from being one of just a few hardy souls a few years back to now attracting a good number of the UK’s top racing talent and those looking for a good introduction to SUP racing.
In sports such as cycling or motorsport, performance analysis systems (such as devices like power meters or real-time telemetry) can inform a competitor how well (or not) they are doing. SUP is currently relatively limited beyond that of the humble stopwatch, a GPS unit or stroke sensors. However, I work at a university whereby I specialise in sports technology research and last year started SUP racing as a means of cross training. I was curious to see how paddlers were doing in the series relative to each other.
To attempt to answer this, you need to define a consistent benchmark to compare any paddler against. This is a tricky process because peoples form fluctuates and races vary. The method I’m using here is to calculate a sample of the 10 fastest paddlers in each race and then to average their finishing times. This becomes a sample of the basic ‘society’ of each class at each event. Because the make-up of the top 10 has seen virtually the same paddlers from race to race, it allows you to establish a relatively consistent general standard for each event. We’ll call this metric ‘the pack’. Then, I calculate the percentage difference in the race completion time of any individual paddler against this pack. This isn’t a fool proof method as the baseline can be skewed occasionally by a strong or weak paddler (as I’ll talk about later on). However, on the whole, it adds value beyond that of just what position the paddlers finished in and does give some indications as to their form and ability.
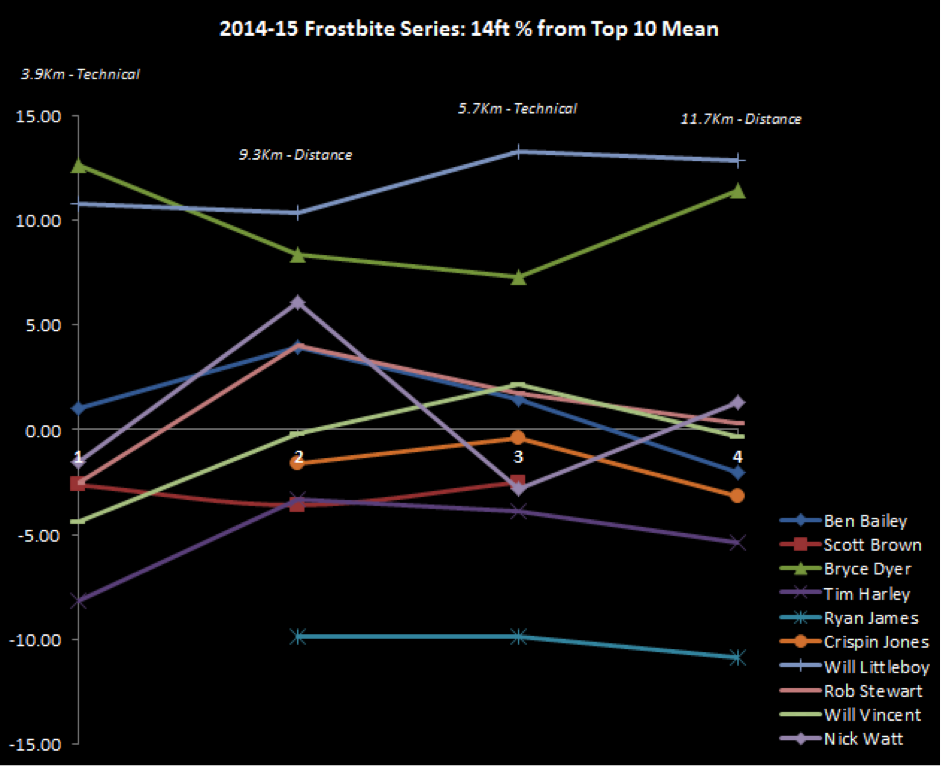
The Frostbite race series itself is a total of 6 races with 4 to count. 3 of the events are flat-water distance races and 3 are technical races. For this analysis, I create a simple graph of all the paddlers that have completed at least 3 of the races so far so that we can establish the barest minimum of a trend for each one. If the line on the graph for a paddler ever points downwards from race to race, it’s an improvement against the pack, if it points upwards, it isn’t. I’ve also noted on the graph both the distance and the type of each race that took place. The Y (vertical) axis of the graph shows the percentage difference from the pack average (which is defined as the graphs horizontal axis ‘0’ marked line). I should also add that’s it’s not best scientific practise to join a paddlers race to race performances up with a line. This is because that they are technically independent from each other. However, this does make it visibly easier for you to spot each paddler and then see how they are doing. As a result, I have done that here. We’ve now completed 4 races so far so let’s take a look at how the men’s 14 foot class are shaping up in the graph shown below.
In this class, we have 10 paddlers with at least 3 finishes so far. Current 14ft men’s national champion Ryan James (Mistral/ZRE) has been dominating this class by relatively big margins (as you can see by his light blue line being far away from any others and well below 0 as a trend). Race 4 was a long river race which proved hard work for all. It saw challenging headwinds and saw several paddlers retiring early. You can see here that I personally floundered that day whereas Ryan achieved his best win margin in the series (showing a gentle downward sloping line from race 3 to 4).
The next thing to see is how awfully tight things are getting for the other podium places. In race 1’s short, technical affair, the paddlers finished well spread out. However, as the events have gone on (despite the format and distance changing), those at the sharp end are getting closer together. In the 14ft class, both Scott Brown and Tim Harley are noticeably dancing around each other. There is a second group just off of these containing Ben Bailey, Crispin Jones (Starboard UK), Nick Watt (Starboard UK), Will Vincent and Rob Stewart (West System/Boylos). Nick Watt is the wildcard in the class so far with a large yo-yo’ing performance from one race to the next. However, look a little closer and you’ll see it’s because he’s doing extremely well in the technical events compared to his distance outings.
Notice how the majority of the field seemed to have improved in race 4 ? (i.e. with a downward pointing line). However, this is an example of data skew that I mentioned earlier on. In this case, I personally had an off day (finishing in 9th, but still some way back) – the gap was so large of my finishing time to the average that day that it pulled the entire pack average down. You may also notice that several paddlers’ lines remain in parallel to each other from race 3 to 4. This potentially suggests that they (as a group) are likely holding their form. Anyone else bucking this trend (with a line pointing up or down with more gradient) is where you want to be looking as the main reasons for change in the packs performance. Either way, at this point of the series (and with just two races remaining), Ryan only needs another podium placing to seal the series win but 2nd and 3rd places are less clear cut and will likely come down to the wire and the use of any discards.
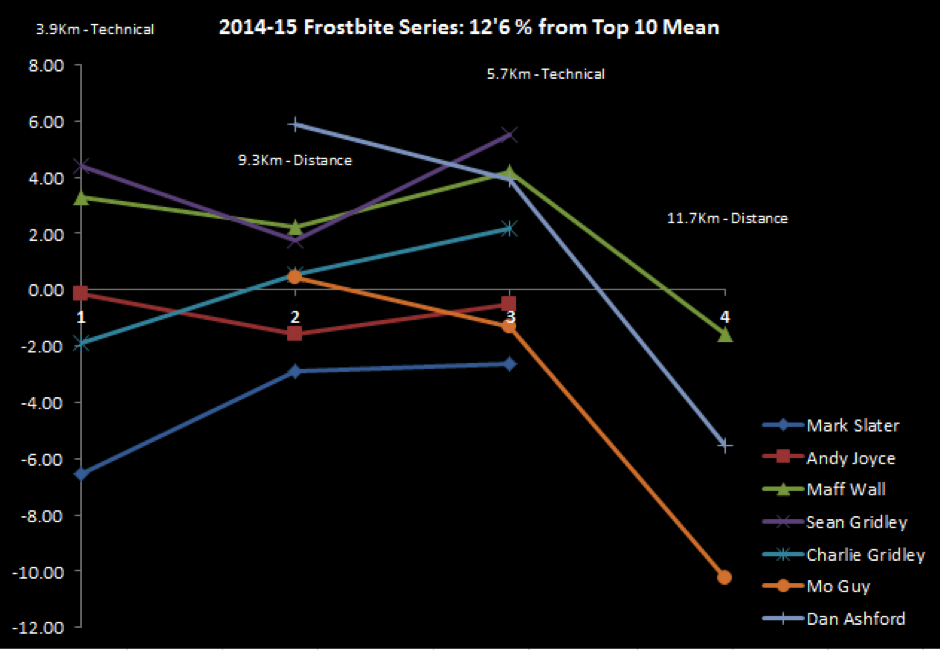
Now let’s take a look at the men’s 12’6 class. Here is their graph:
The 12’6 class did have similar entry numbers to the 14ft men in races 1-3 but race 4 saw a few of the regulars taking a breather. Despite this, the racing in this class has been even more competitive than the 14’ft class. The lower entry of the regulars in race 4 has pulled the average up though, showing everyone seeming to have improved massively. However, this again is an example of data skew. It’s likely that this is partially due to both Mark Slater (Fanatic/ION) and Andy Joyce (Starboard UK) being absent from round 4. Slater looks well in control of the series overall thus far but behind him look at the parrying and weaving of Joyce, Sean Gridley and Mo Guy (Jimmy Lewis/Superwiki Paddles). The overall podium could prove very tight with these three. Mo Guy was particularly smart to race the last one to chalk up good points when others decided not to. Along with these, Dan Ashford looks to be a man to watch with very good round to round improvement. Finally, it’s also worth noting that top UK paddling stalwart Pete Holliday (BIC) has also been doing well with a string of strong results. However, rather than sticking to one class, he’s so far done two races in each (and never being off the podium in either). Race 5 will therefore prove interesting in the battle for the overall podium in both classes as the closeness of the 12’6 guys may be entirely dependent on which board length Pete decides to race for the last two events. By the way, there have been ladies competing too but there haven’t been enough paddlers to do a thorough analysis yet.
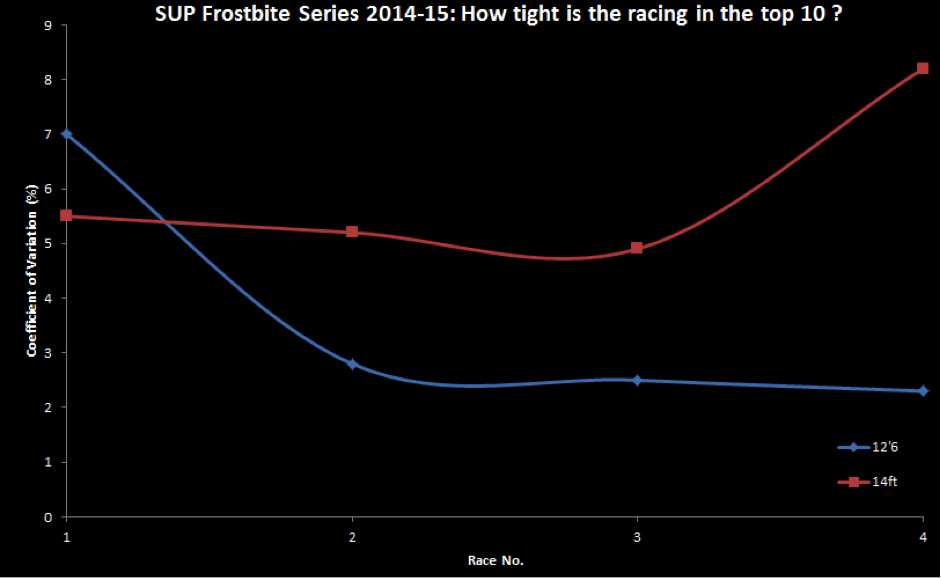
You might also want to know how tight is the racing in the series so far ? I can calculate a statistic known as the ‘Coefficient of Variation’. I won’t bore you with the figures but what you basically end up with is a percentage of variability of the fields finishing times. By calculating this for both the 14ft and 12’6 classes, I can compare how close together the typical top 10 racers are.
As you can see above, the results were quite spread out in the top 10 of the 12’6 class in race 1. However, over the next 3 events, the coefficient of variation reduces heavily (and is nearly twice as close as the 14 footers). This suggests things are increasingly competitive between the 12’6 paddlers. Both fitness and clean buoy turns are going to be a must in the final 2 events and any mistakes could be costly. Alternatively, the 14ft class was stable until race 4 (despite changing race type and distances). This was caused by the gap from the pack average to both myself and Will Littleboy (Fatstick) increasing. That made the packs behaviour broader in finishing time spread.
Next time, we’ll update these stats and look at how everyone has performed in round 5. I’ll also add in other paddlers and maybe attempt to answer questions like ‘who is the best improver?’ and ‘how much faster is a 14ft board over a 12’6?’ in the series. The next BaySUP Frostbite event is down on Boscombe seafront, near Bournemouth, on Saturday 14th March. Details of the remaining events are here.
Words by : Bryce Dyer
Pretty interesting statistics (once you’ve got your head into it!) The SUPboarder Team really look forward to seeing more of Bryce’s stats following race no 5. And see if he can answer the million dollar question “How much faster is a 14ft board over a 12’6?!!”
